
November 2021
I have been really interested to see what TTOs are investing in patenting offshore and where they are patenting. The Second National survey: 2014 – 2018 (South Africa[1]) has some figures hidden in the “Selected Aggregated Granular Survey Data” section at the back of the publication on patents granted in foreign jurisdictions. My interest is driven by my concern whether from a University of Cape Town (UCT) TTO perspective as to whether we are fully capitlising on our foreign patent applications and seeing a return.
Cost of Granted Foreign Patents
In researching costs, I came across a gem that I have always wondered about. If you took a patent in the nearly 200 countries in which you can apply for patent protection it would cost $1 million, with another million to maintain those patents to term![2]
So, based on rough estimates of recent costs up until grant the cost of the foreign IPR Act IP patents reported in the survey is approximately R 47 million, excluding ARIPO. Note I have not inflated historical costs, have tried to select from UCT data for the most recent grant in a territory, which can be 2018, but most are more recent, and one needs a larger dataset to actually get a better average, as the number of office actions received during patent prosecution will vary from application to application.
The revenue over the period is R156.2m (based on figure 5.5 of the survey for IPR Act IP1), which reassuringly exceeds the foreign patenting costs reported in the survey. But one needs to remember, that there is also revenue from South African licensing in this revenue figure (again in a future survey it would be interesting to tease the actual foreign revenue out). Also, if one looks at the quantum of revenue per IP transactions (figure 54 in the survey) it would appear that there are no big hitters greater that US $ 1m/yr, and only one or two in the R1.5m to US $1m/yr band, so this may point towards the revenue likely being relatively well spread across the different transactions.
Selection of Countries for the Survey
Some may find the selection of countries that were reported on in the survey somewhat random, but they were actually selected from South Africa’s top export trade partners by value[3], as well as BRICS countries. ARIPO was selected to give an indication of African patenting and perhaps this needs to be explored in more detail in future surveys against the backdrop of the African Continental Free Trade Area[4] which commenced on 1 January 2021.
28 out of the 37 institutions (Science Councils and Higher Education Institutions) who participated in the survey indicated that they had patents granted in foreign territories during the review period emanating from IPR Act IP (as defined in the survey).
Compared to the 2014 data set there were fairly significant increases in the number of patents granted over the survey period in the USA, European Countries, China as well as the countries that fell into the “other” category – i.e. not specifically identified. In contrast, grants in the BRICs[5] countries were low, and remained flat, except for China, which rose significantly.
One needs to bear in mind that patent applications were likely to be made three years before the date of grant (if not more), but there was a peak in grants during the 2016/2017 periods.
South Africa’s Top Trading Partners3
(% of total South African exports)
- China: US$9.8 billion
- United States: $7.2 billion (8.3%)
- Germany: $7.1 billion (8.2%)
- United Kingdom: $4.2 billion (4.9%)
- Japan: $3.8 billion (4.4%)
- Netherlands: $3.3 billion (3.8%)
- Botswana: $3.3 billion (3.8%)
- India: $3.3 billion (3.8%)
- Mozambique: $3.1 billion (3.6%)
- Namibia: $2.7 billion (3.1%)
- Belgium: $2.4 billion (2.8%)
- Zimbabwe: $2.2 billion (2.6%)
- Zambia: $1.7 billion (2%)
- United Arab Emirates: $1.5 billion (1.8%)
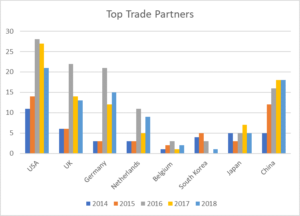
Figure 1: Patents Granted Annually in Top SA Trade Partner Territories (data from survey1)
BRICs Patenting
I would have anticipated that technologies geared for developing countries such as South Africa, would have relevance for BRICs countries, yet there is not much activity there – albeit that only “grants” are reported and it is possible that certain applications are either still pending, or that patenting is not possible – e.g. GMOs and India.
China bucks the trend. It is likely a numbers game that TTOs may be considering in terms of population. Getting into the market or licensing there can be challenging without a Chinese partner to assist. Oxford University has established a satellite TTO there and notes – “The organisation provides a local point of contact for all Oxford University Innovation activities from individuals located in China”[6].
It is possible that TTOs are pinning hopes on a corporate licensee with the means to commercialise certain technologies on a global basis, who would have a footprint in markets like China, and know how to navigate the terrain.
India, Brazil and China all have measures in place, at least in certain sectors based on UCT experience, either requiring a level of local manufacture or assembly (also can be as a requirement for regulatory approval), or trade tariffs (up to 40% duty) that make imported equipment (including medical devices) significantly more expensive.
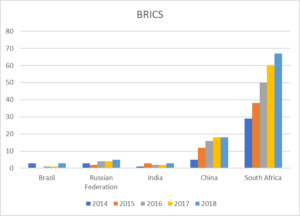
Figure 2: Patents Granted Annually in BRIC Territories (data from survey1)
Africa
Looking at Africa, ARIPO (member states show in the map) may not necessarily be a good marker for African patenting activity. A number of member countries permit direct applications and the survey may miss them. ARIPO patent renewals escalate exponentially as time passes, making them difficult to afford if one is not actively exploiting the IP commercially. There are 18 contracting states[7] and one can file in any of the Contracting States or directly with the ARIPO office.

Pharma Sector Patenting
At a 2009 conference in the USA, I recall that from a pharmaceutical market value perspective it was considered that if you had protection in the USA, Europe and Japan you would have covered 97% of the market. In fact, you could also essentially pick the “EU-5” in Europe (i.e. Germany, UK, Italy, Spain, France) and get the bulk of the European market value[8] – see figure 3.
These countries are not all in the “top European trade partners” listed in the NIPMO survey, but probably Italy, France and Spain that are missing, report in the “other” category and it would be interesting to be able to dissect the “other” category more.
In 2009 China was not as prominent on people’s radars and certainly it is up there with Japan now and a more important consideration. More recent figures provided by the Association of the British Pharmaceutical Industry shows the now important role of China, but the USA remains the dominant player. Interestingly also, Europe on the whole has declined in terms of market size.
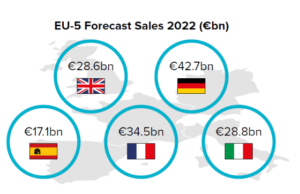
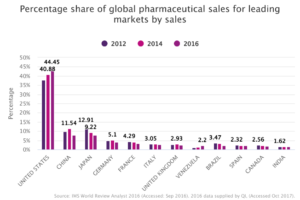
Figure 3: Top Territories by Value in Global Pharmaceutical Market5
Important to Improve the Impact of Foreign Patents
A question that I continue to consider with the team at UCT, but that I assume is equally important for our South African TTO community, is whether foreign filing is paying off and if not, how we can improve the potential. In a future survey it would be interesting to assess the number of granted foreign patents that have been licensed and that are attracting revenue.
For South African “deep tech” start-ups it is difficult enough for them to establish themselves in South Africa, let alone widely penetrate foreign markets in the short term; tech start-ups perhaps have an easier time. It can be difficult for local licensees to fully exploit patent families that include a slew of foreign members.
In case you missed it, Jetane Charsley, Acting Head: NIPMO mentioned at the conference that the next survey will be rolled out in 2022/3!
This article represents my personal views and does not represent the views of SARIMA or the University of Cape Town.
Written by Dr Andrew Bailey, Senior Manager: Innovation, University of Cape Town.

[1] Second-SA-National-IP-TT-Survey-Report_Web-Ready.pdf (sarima.co.za)
[2] How much does it cost for international patents? – Invention City
[3] Top South African Trading Partners 2020 (worldstopexports.com) accessed 14.11.2021
[4] African Continental Free Trade Area – Wikipedia accessed 14.11.2021
[5] Brazil, Russia, India, China (South Africa not included)
[6] Oxford University Innovation in China
[7] Patents – The African Regional Intellectual Property Organization (ARIPO)
[8] Evaluate-European-Drug-Forecasts-Infographic-IG.pdf (evaluategroup.com) accessed 14.11.2021

